Deviation Levels
- Close Ninja
- Click And Download Toolkit
- Open and Login
- Install Latest Version
- Go to Charts - Right Click - Indicators - A.P.E.X. Diagnostic Deviation Levels - Add
Note these levels are for Ninja Trader 7 Only. Within the coming year 2020 we plan on making them for NinjaTrader 8 as well.
A video on the indicator and a forum post can be found:
Here: https://forum.apexinvesting.com/t/deviations-and-deviation-levels/761/20
If you need any tech support please click here for free assistance
NOTE: Deviation Levels Are Based on Settlement Value For Accuracy. To Learn more see bottom of this page. (We do all the hard part and pull the numbers off the exchange sites etc… We just mention it so you will know the answer when you see that the settlement close may differ from a closing price on a chart.) Settlement values are also better number to use for Gap Fill Trades.
What Are Diagnostic Deviation Levels and How Do I Use Them?
- The Diagnostic Deviation Levels use 2 proprietary formulas. One extracts and then factors in the implied volatility of 4 underlying options over several option months for the specific market. The other formula takes the result of the first calculation and then defines the deviation (expansion/move expectation of the market) in either direction. The net result are the Diagnostic Deviation levels which you see o the provided deviation tables each day.
- It is a leading indicator as it uses all market participants consensus in option pricing to see what the forward expectation is in the market for the distance of a move in either direction. Since it uses the markets expectations it is a leading indicator of solid pivots/support/resistance levels.
- These levels are for a 1 day expected move from the previous days close (On Monday it looks at Friday’s close even if the market is open on Sunday).
- Use these levels as maximum expected moves to set target levels for profit and for potential reversal plays off these levels.
- They can be used for having proper expectations on potential profit targets for trading spreads and binaries
- They are essential to use when calculating distance to breakeven and expected potential profit versus maximum potential profit.
- They can be effective for selecting binary strikes to buy or sell for directional plays
- They an be effective for selecting binary strikes for neutral strategies to collect premium
- They are great when looking at potential reversal plays and where to do them.
- They can verify confluence of fib levels, support/resistance, volume breakdown etc… to provide further credibility to your current technical analysis.
- The diagnostic deviation formula was designed primarily for intraday or short term deviation moves. This was built specifically for trades that last less than 5 days whereas most Deviations were built for weeks/months/years.
- Standard deviations that uses past volatility and movement so it is lagging and therefore less accurate and has nothing to do with forward expectations of market participants.(We use the symbol σ = Diagnostic Implied Deviation. Standard deviations models will simple use σ).
- Other non-standard deviation models are built for calculations over longer periods of time. Making them less accurate for shorter time frames.
- Standard deviations that uses past volatility and movement so it is lagging and therefore less accurate and has nothing to do with forward expectations of market participants.(We use the symbol σ = Diagnostic Implied Deviation. Standard deviations models will simple use σ).
- Pivot levels are a math based calculation based on past price levels and is therefore not a leading indicator but a best guess. Diagnostic deviation levels uses the close of yesterday and the forward deviation level to calculate levels.
- Most importantly these levels are derived from how far the MARKET expects the MARKET to move. They are the MARKET’s expectations. This is why they have a such a high level of accuracy as they are objective and based on all market participants.
- How are our Implied Deviation Levels Different?
- First Darrell Martin invented them in 2010 through the guidance of a floor trader who used them for floor trading for a different type of strategy (not day trading). We have done this longer than anyone and been (copied) by many but never fully duplicated.
- Many have tried to copy our formulas but they do not when to pull the volatility at the correct time. Our formula knows when to pull the IV for the Deviation formula to ensure optimal accurate of IV within the options for the upcoming day
- We provide our levels FREE others charge for them
- Our levels also are able to produce deviations on over 20k markets including futures, stocks, and spot forex.
- We have band ranges around deviations that can be turned on or off
- You can disable levels if you desire (ie the .5 etc..)
- You can enable alerts on any level you desire
- You can modify color thickness etc..
- Our levels automatically calculate on our server and plot on your chart.
- Our levels have a variety of indicators such as deviation high to low. We also have indicators we have made for Deviation Reversals and for any time frame deviation move to know the expected move ie within 1 hour 10 minutes an hour etc… These are part of our silver elite package
- First Darrell Martin invented them in 2010 through the guidance of a floor trader who used them for floor trading for a different type of strategy (not day trading). We have done this longer than anyone and been (copied) by many but never fully duplicated.
Should I plot the levels on a chart?
- Good news they auto plot for you. You just add the indicator 🙂 Plotting the levels will make sure you notice when they are hit – this is crucial! This is done automatically and for free.
- Other key areas to consider and that are good to plot on your chart are:
- Overnight High/Low
- Yesterday’s High/Low
- Yesterdays’s Close
- Previous Highest volume bars price (high price on up bar in up trend – low price on low bar in down trend)
.25 σ
- .25 σ = 17.5% chance it will not break out or touch this level (82.5% chance it will breakout/touch this level)
- [Note this is a probability of touching not expiring at that level.]
- You will be surprised by how accurate the .25 level is and how it can be great for trading around settlement
- When directional look to tighten stops when you are directional and the price exceeds the .25 σ
- Note low volatility days (i.e. no news) – ..25 σ is more like a 1 σ on % chance of breakout]
- Volume is key…if it is not breaking through this area with volume or approaching it with lower volume there is a higher probability of a reversal. If it breaks through it with volume there is a higher probability it will continue higher.
.5 σ
- .5 σ = 34% chance it will not break out or touch this level (66% chance it will breakout/touch this level)
- [Note this is a probability of touching not expiring at that level.]
- When directional look to tighten stops when you are directional and the price exceeds the .5 σ
- Note low volatility days (i.e. no news) – .5 σ is more like a 1 σ on % chance of breakout]
- Volume is key…if it is not breaking through this area with volume or approaching it with lower volume there is a higher probability of a reversal. If it breaks through it with volume there is a higher probability it will continue higher.
.7 σ
- Look to tighten stops again at .7 σ. (Very important!)
- This level is less about probability and more about tightening stops, taking profits, and looking for potential reversals
- You may want to consider taking partial profits at this level.
- Volume is key…if it is not breaking through this area with volume or approaching it with lower volume there is a higher probability of a reversal. If it breaks through it with volume there is a higher probability it will continue higher.
1 σ
- 68% it will not break out or touch this level (32% it will breakout/touch this level)
- [Note this is a probability of touching not expiring at that level]
- Unless you are seeing a significant breakout in volume then you may want to take some/all profits at this level
- From this point forward you will want to tighten stops if it continues to rise/fall
- Volume is key…if it is not breaking through this area with volume or approaching it with lower volume there is a higher probability of a reversal. If it breaks through it with volume there is a higher probability it will continue higher.
1.5 σ
- This level is to provide a profit target/reversal target when the market does break through the 1 deviation with some volume through the 1σ level as it often will not move far enough to hit the 2 σ level.
- There is no need to chart this level unless the underlying hits the 1σ level
2 σ
- 95% it will not break out or touch this level (5% it will breakout/touch this level)
- [Note this is a probability of touching not expiring at that level]
- Unless you are seeing a significant breakout in volume then you may want to take some/all profits at this level
- If you stay in from this point forward you will want to tighten stops if it continues to rise/fall
- Volume is key…if it is not breaking through this area with volume or approaching it with lower volume there is a higher probability of a reversal. If it breaks through it with volume there is a higher probability it will continue higher.
- Rarely will you chart this level
3 σ
- 99.7% it will not break out or touch of this level (0.3% it will breakout/touch this level)
- [Note this is a probability of touching not expiring at that level]
- It is extremely rare (October 2008 rare) for these levels ever to be hit through there are instances – if they are hit the chance of them passing this level is basically .3% – taking profits and looking for reversals is usually key at these levels.
- Very rarely will you chart this level
- This number is not exactly 3x 1 deviation.
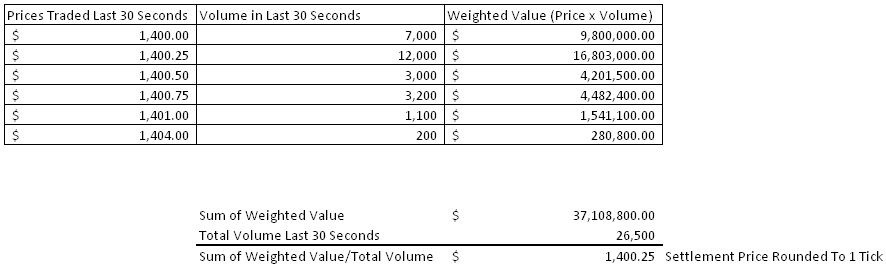
Settlement is what is used by floor traders to calculate buy/sell points, institutional traders for a variety of algo programs, and by the exchange for mark to market profit and loss, it is also used by the exchange to determine if an option is in the money at expiration. Due to these facts it is a more accurate way to plot the deviation levels.
Note the settlements values are for the CME as posted on their site, ICE posted on its site, and other applicable exchange sites. For Nadex the settlement value may differ as it is based on a vwap from Reuters. See how settlement is calculated by Nadex in the Tutorial Nadex Intro/basic videos for more information on this.
The settlement value is derived from the last 30 seconds to 1 minute of trades and weighted by volume.
This gets rid of erroneous trades and better follows how large trades use the close. Please let us know in the forum or help desk if you have any questions.